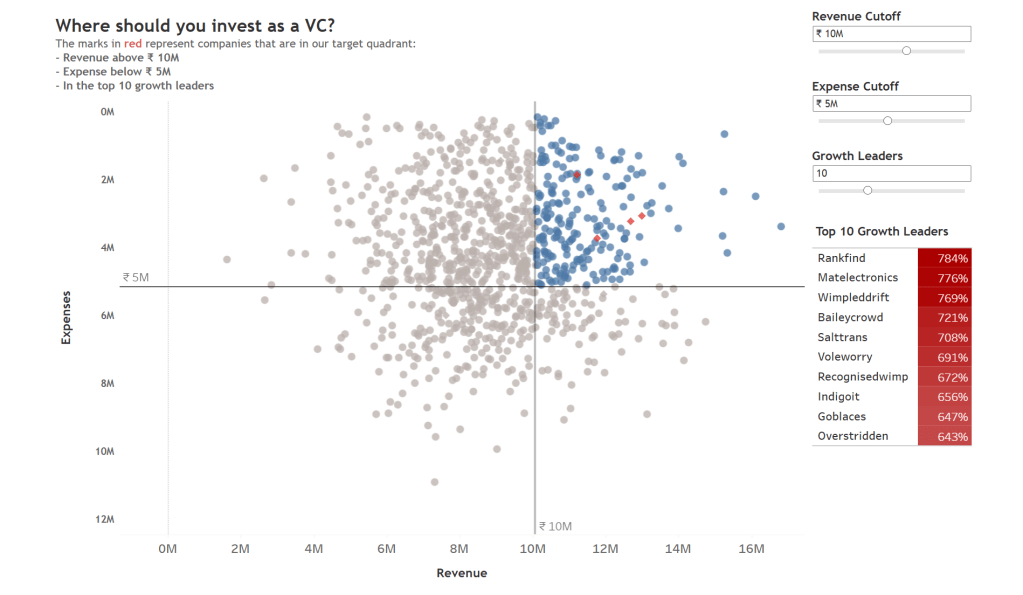
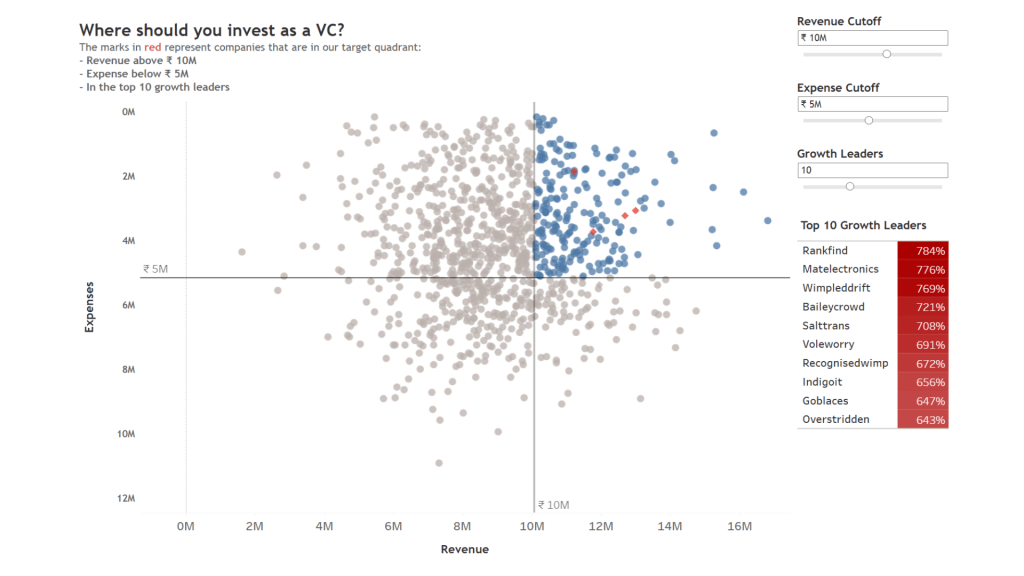
I worked on creating a dashboard that helps VCs decide which startups they should invest in.
The dashboard marks the expenses (along vertical axis) and revenue (along horizontal axis) for each startup. For each startup, there is a growth % compared to the previous year. Our target quadrant would be companies with revenue above a certain number, expenses below a certain number and growth % among the top N. This target quadrant is marked by startups in red. The ones marked in blue are the startups with revenue above the set cutoff and expenses below the set cutoff.
Paramaters that you can play around with are revenue cutoff, expense cutoff and growth %.
The y-axis is inverted so that it is easy to spot the top companies.
Here is the Tableau link for the visualisation.
